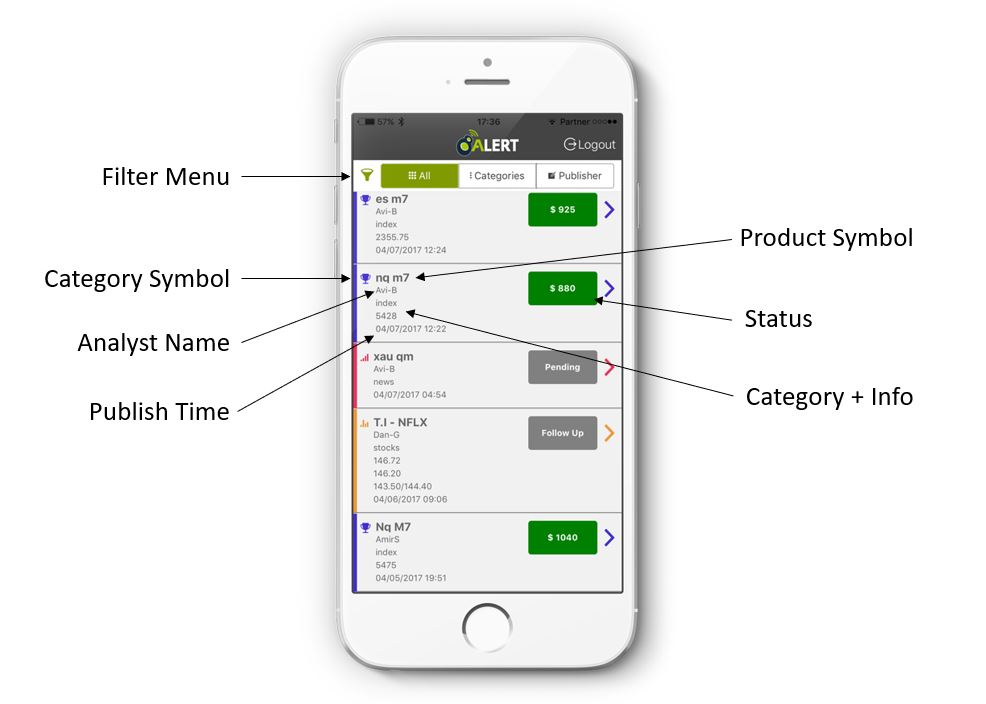
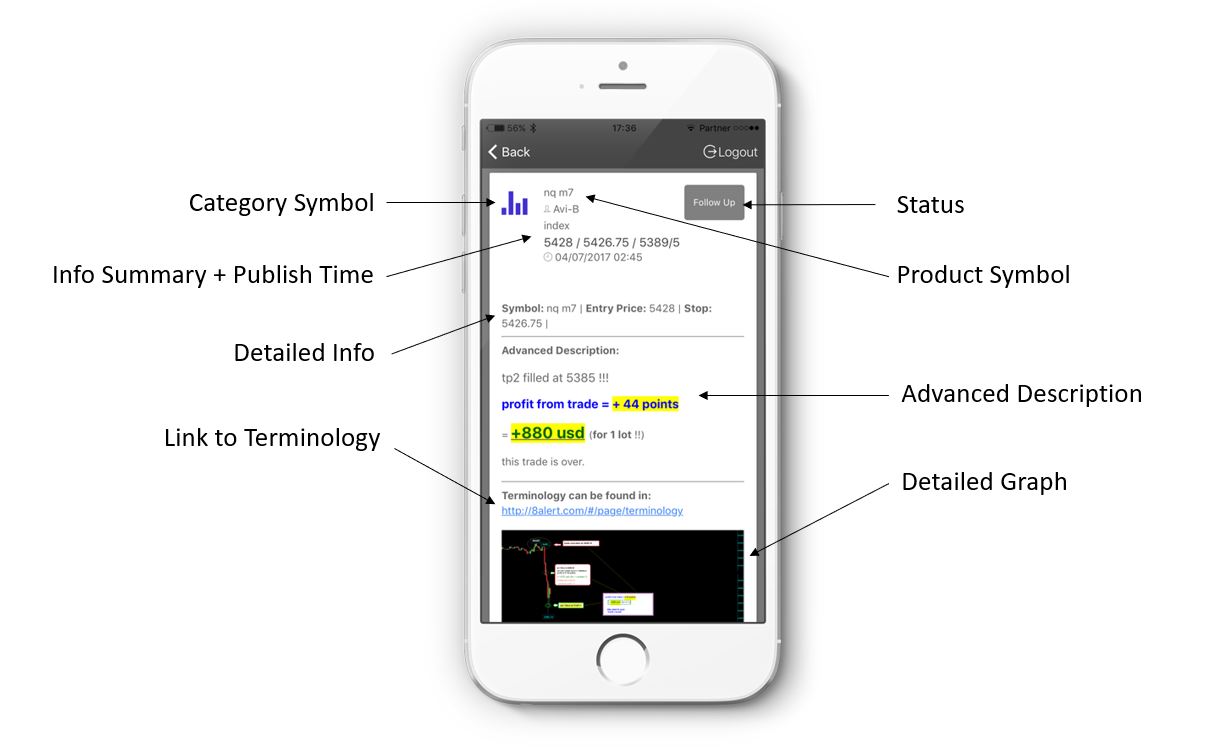
Category Symbol: Represents the symbol and color of each category
Product Symbol: Shows the product’s symbol
Status: Shows the status of the trade:
Analyst Name: Shows the name of the analyst/publisher who published the signal
Info Summary: Shows a summary of the information of the signal and the Publish Time – The time the signal was published. The time zone is GMT+0.
Detailed Info: The information presented in this section depends on the signal’s status.
It shows the position, entry price, close price, stop, take profit and PNL(profit and loss).
Link to terminology: Opens the terminology page
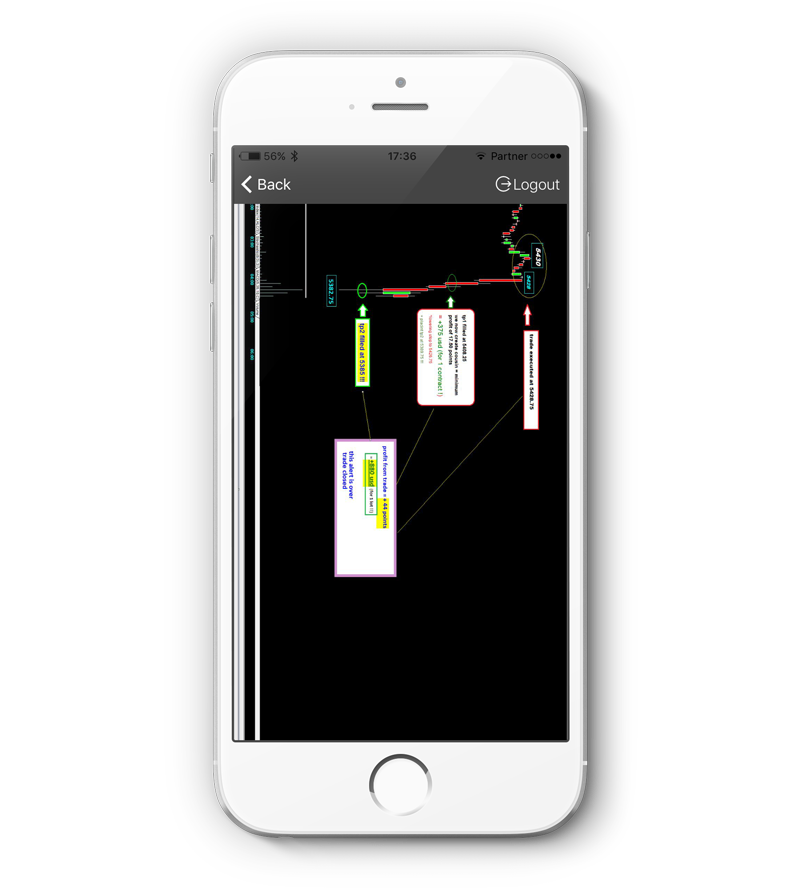
Detailed Graph: Shows the graph/s published with the signal. Clicking on the image will open its full display